Freight demand jumps nearly 5% and van contract rates hit a 52-week high: SONAR puts tender volume at 11,600, rejections at 12.95% and van spot at $3.49 a mile
FreightWaves reports SONAR's latest review: tender volume climbed nearly 5% week over week to 11,600, a level last seen in late spring, with the tender rejection index at 12.95% and flatbed rejections at 21%. Van spot rates reached $3.49 a mile on Nov. 9, the van contract linehaul index hit a 52-week high of $2.85 a mile, LTL cost per hundredweight rose to $48.98 in October, and diesel eased about $0.06 on the week.
Summarized from FreightWaves.
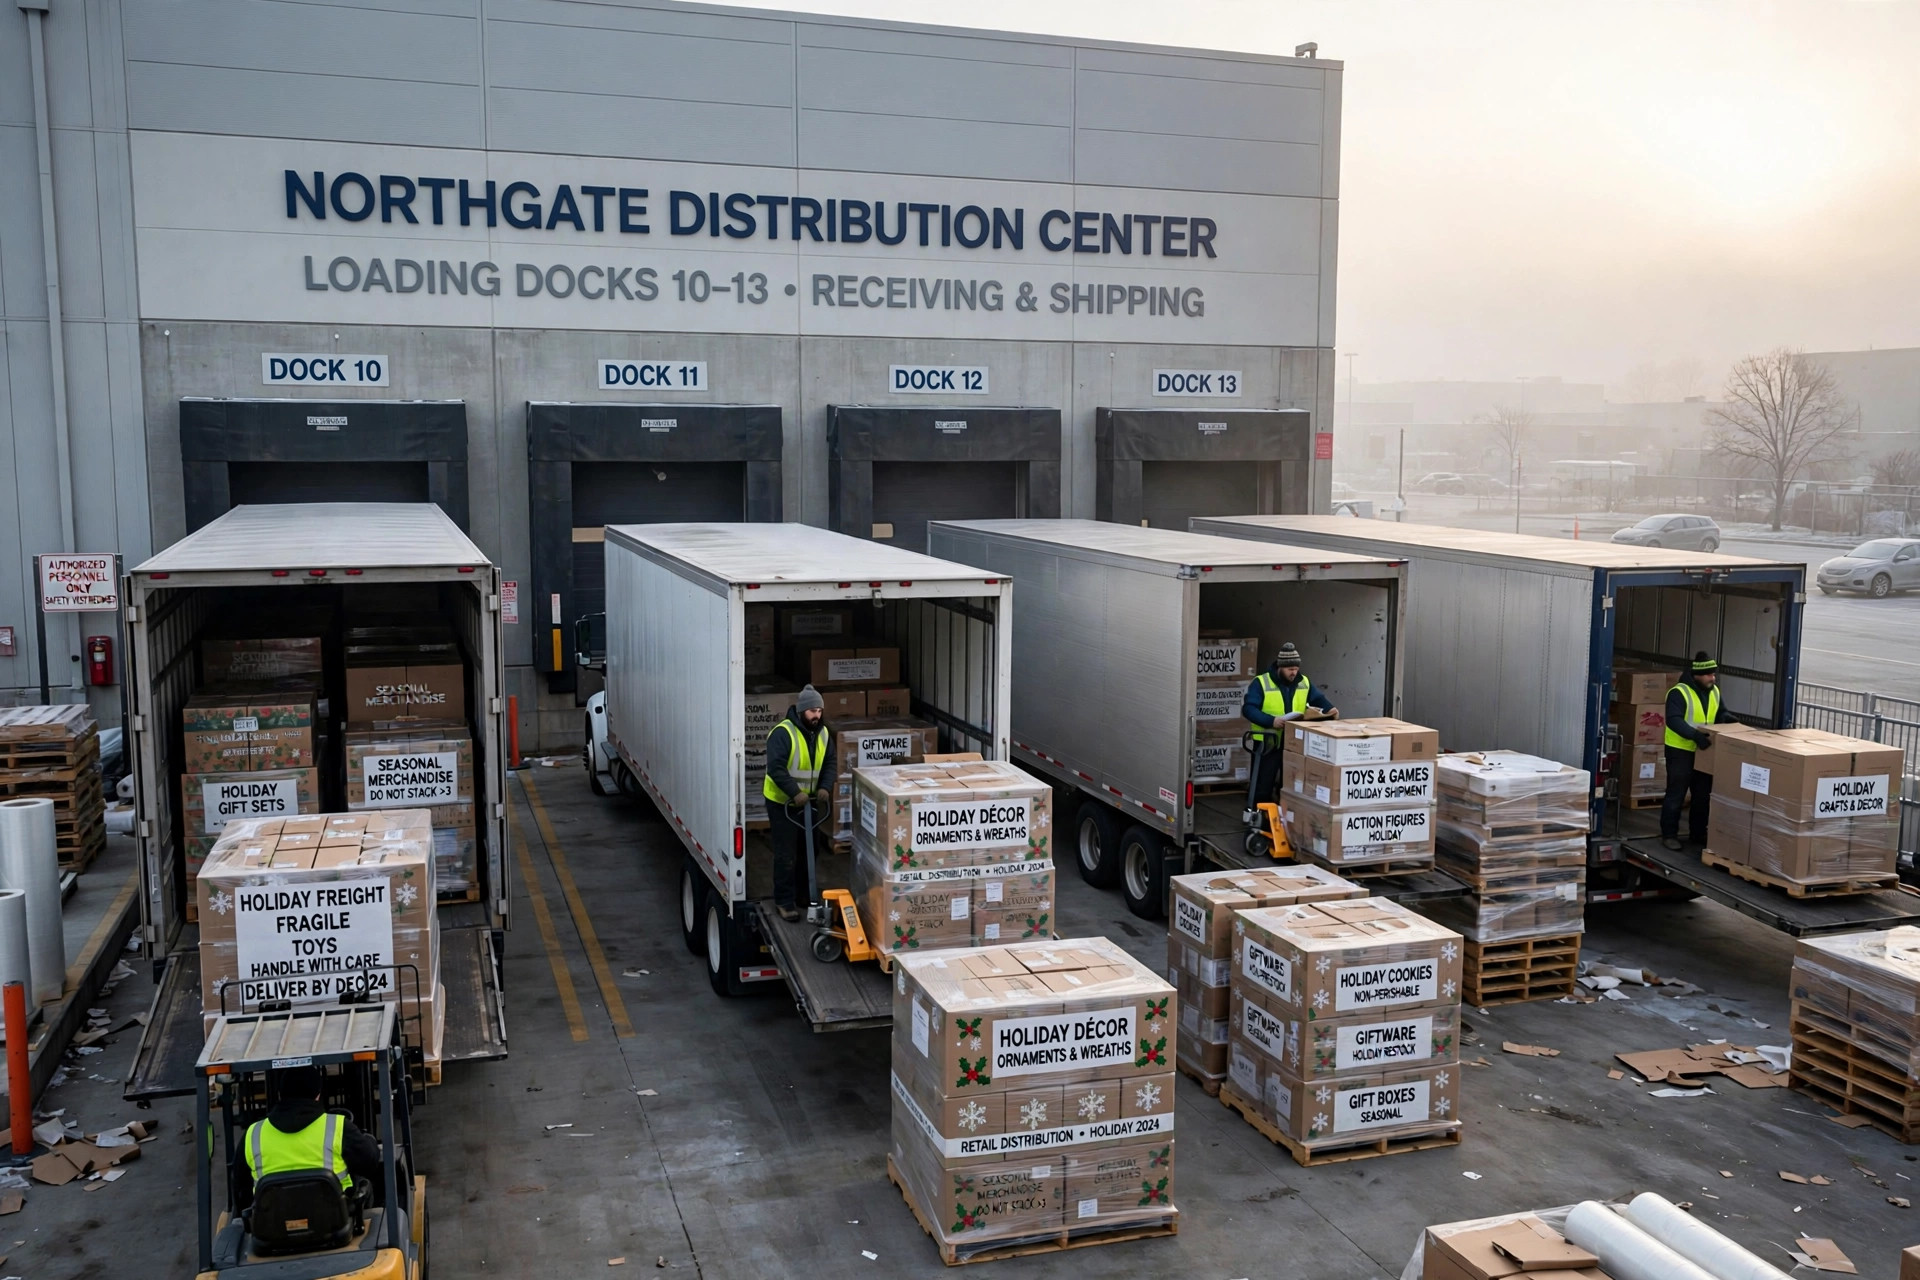
Image: Illustration: AI-generated by CDLWire
Truckload freight demand climbed nearly 5% week over week, and spot rates are still rising into peak season, according to FreightWaves on Nov. 9, reporting a SONAR data review presented by Julie Van de Kamp. The SONAR Tender Volume Index reached 11,600, up from just under 11,000 on Oct. 22 — a level last seen in late spring. The uptick is arriving in an already capacity-constrained market, and shippers face compounding pressure on rates and capacity access as peak season accelerates.
Tender volume counts the loads shippers offer carriers through electronic tenders — the earliest signal of how much freight is moving, before any of it reaches a load board. A reading of 11,600 puts tendered freight back where it was in late spring, after a summer and early fall in which it had drifted lower, and the gain is arriving while truck supply is still thin. The review pairs the demand rise with the Outbound Tender Rejection Index — the share of tendered loads carriers turn down — which held at 12.95%, up 0.22 percentage points week over week, while flatbed rejections were even tighter at 21%. When demand and rejections rise together, more freight is being offered and a larger share of it is being refused: the signature of a market in which carriers can pick their loads.
Van spot rates are following the same direction. Van spot rates reached $3.49 per mile on Nov. 9, up from $3.44 in September, with broad rate increases over the prior four days across most of the national spot market map. The bright spots Van de Kamp named were Wyoming, Utah, Montana and Laredo, and the pockets of softness were concentrated along parts of the East Coast and in select Midwest markets including Rock Island, Illinois, Madison, Wisconsin, and Philadelphia. The spot number is a SONAR measure, built from a different data set than the load-board figures CDLWire published yesterday from DAT's week ending Nov. 6, so the two should not be compared dollar for dollar — what they agree on is the direction, and the SONAR read adds the timing, with rates rising over the past four days rather than over a finished week.
The more important number for drivers who run contract freight is the one that does not move day to day. The van contract rate per mile linehaul index — BCRPM1 — hit $2.85 per mile, a 52-week high, Van de Kamp noted, and the simultaneous rise in spot and contract rates suggests the market is not experiencing an isolated or short-lived spike. Contract rates are agreed in advance for the freight that makes up most of a large carrier's miles, and they reset slowly, usually in quarterly or annual bids. A 52-week high means the contracts being signed now are pricing in the tightness spot rates have shown for months — and it is the number that decides whether a carrier can afford the pay increases its drivers are asking for. For an owner-operator, a contract lane offered at last spring's rate is now a below-market offer, and the data to push back with is a published 52-week high.
The less-than-truckload side is moving the same way. Cost per hundredweight rose from $46.78 in August to $48.98 in October, a gain of roughly $2.20 over two months, and SONAR's platform now breaks the figure down by region and by length of haul — city, short-haul, tweener, mid-haul and long-haul — giving shippers and brokers a clearer view of where LTL pricing pressure is most acute. LTL freight is the palletized, multi-shipper freight that fills a trailer with several customers' loads, and its cost per hundredweight measures what a small shipment costs to move. A $2.20 rise in two months is the LTL version of the same capacity story the truckload numbers tell.
Fuel eased on the week. The Department of Energy diesel price was down about $0.06 week over week as of Nov. 9, though still up $0.09 month over month, Van de Kamp said. The split matters in a negotiation: a lower fuel surcharge trims the all-in number a broker quotes, while the linehaul underneath it is still rising, so the headline rate can look flat while the freight itself pays more.
The calendar is the rest of the story. Thanksgiving falls on Nov. 26, and the weeks between now and then are the year's heaviest for retail freight and food. Van de Kamp said the broader picture remains one of moderately tight conditions, and she will keep monitoring whether the demand uptick persists deeper into the fall peak. The caution is warranted — a single week's tender volume can fade if retailers finish restocking early — but the combination on display, tender volume at a late-spring level, rejections at 12.95%, flatbed rejections at 21%, a contract index at a 52-week high and an LTL cost up $2.20 in two months, is the broadest set of tight-market signals the industry has shown at once this fall. For drivers, the takeaway is to negotiate on the linehaul and the contract lane, not on the all-in number the fuel surcharge is quietly shrinking.
Sources
Related coverage
 November 9, 2026 · Fuel & ratesHoliday freight is moving: reefer spot climbs $0.10 to $3.70 a mile in DAT's week ending Nov. 6, and van and reefer trail only 2021 for early November
 November 6, 2026 · Fuel & ratesATA's Costello: the freight market has turned — but it is a supply recovery, not a demand boom, and shipper spending is up 32% on flat shipments
 November 3, 2026 · Fuel & ratesOctober LMI: transportation capacity contracts for an 11th straight month at 38, prices read 88, and new truckload contracts are resetting about 13% higher
Comments
Loading comments…